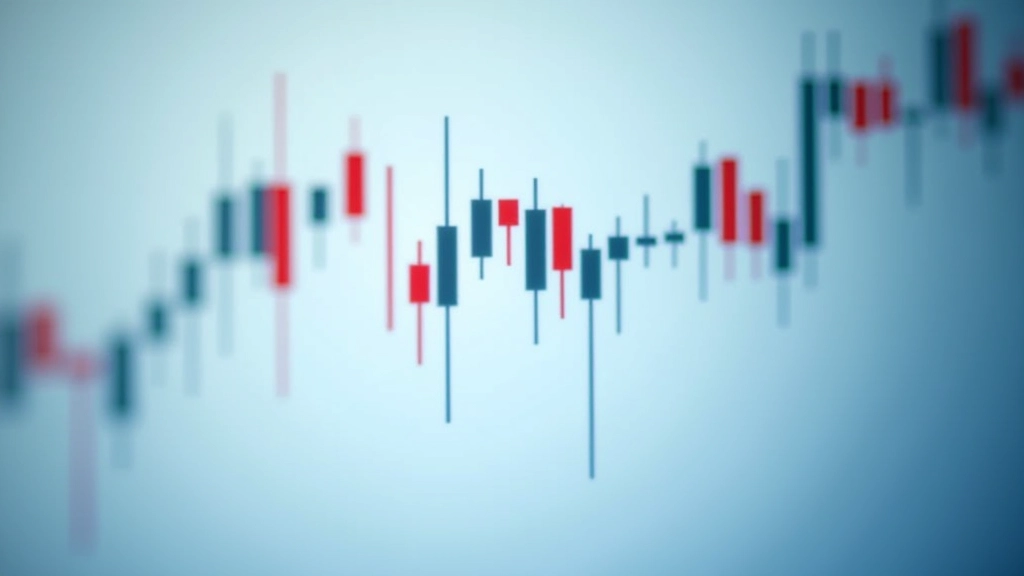
Understanding Candlestick Charts and Price Action
Candlesticks show open, high, low, and close prices. We explain what each part means and how to spot basic patterns that signal price movement.
Why Candlesticks Matter
If you're learning to trade or invest, candlestick charts are the foundation you'll build everything else on. They're not complicated — but they do tell you a lot. Each candlestick shows exactly what happened in a specific time period, whether that's one minute or one day. You'll see where the price opened, where it closed, and the highest and lowest points it reached. That's powerful information in a simple visual format.
What makes candlesticks so useful is that they show sentiment. A long wick at the top tells you buyers pushed the price up but then sellers took control. A small body with no wicks tells you the market was indecisive. Once you understand what you're looking at, patterns start to emerge — and those patterns often predict what happens next.
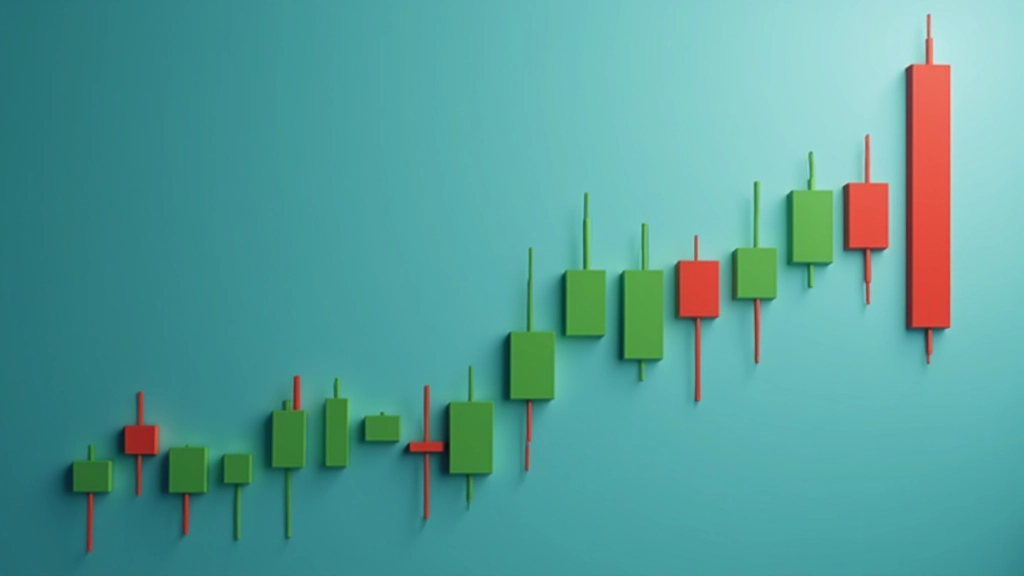
The Anatomy of a Single Candlestick
Every candlestick has four key pieces of information. The body — that's the thick rectangular part — shows the opening and closing price. If the body is green or white, the price closed higher than it opened (bullish). If it's red or black, the price closed lower (bearish).
The wicks (or shadows) extending above and below the body show you the highest and lowest prices during that period. A long upper wick means buyers pushed the price up but sellers stepped in. A long lower wick shows sellers tried to drive the price down, but buyers defended. No wicks at all? That means the price moved in a straight line from open to close.
The size of the body matters too. A large body means there was conviction — buyers or sellers really wanted to move the price. A small body with big wicks shows indecision. The market couldn't decide which direction to go, so it tested both and came back.
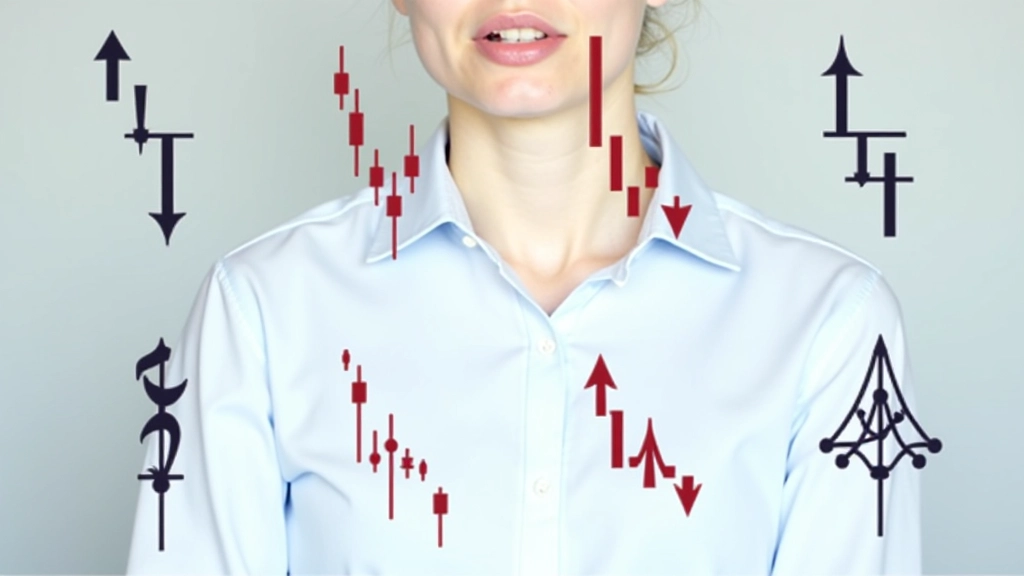
Common Patterns You'll See
Certain candlestick shapes repeat. They're not magic, but they do tell you something about what traders were thinking. A "hammer" has a small body at the top and a long wick at the bottom — it suggests sellers pushed down but buyers fought back. Often appears near the end of a downtrend.
A "shooting star" is the opposite — small body at the bottom, long wick at the top. Buyers tried to push the price up but lost control. This pattern often shows up when prices have been rising and momentum is weakening.
The "doji" is a candlestick where open and close are nearly identical. You'll see just a thin line with wicks extending both ways. It signals real indecision — neither buyers nor sellers could win. This matters because dojis often appear at turning points where the direction's about to change.
An "engulfing" pattern is when one candlestick completely covers the previous one. A bullish engulfing has a larger green body covering a smaller red body — momentum shifted from sellers to buyers in a single period. That's significant.
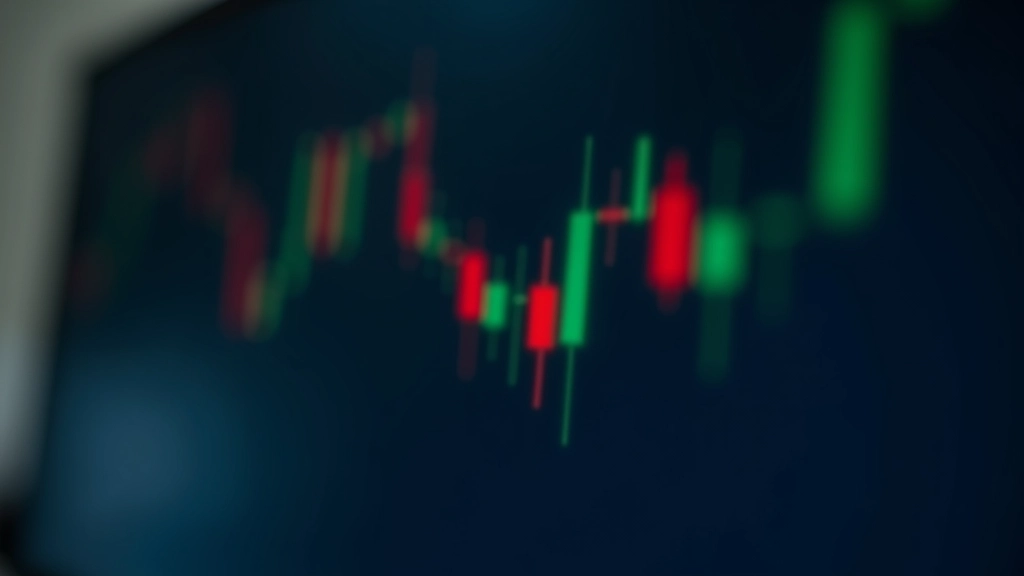
Reading Price Action in Context
Here's the thing — a single candlestick doesn't tell the whole story. You need to look at multiple candles together to understand what's actually happening. That's price action. If you see five green candles in a row with big bodies and no lower wicks, buyers are in complete control. The price is climbing and sellers aren't even trying.
But if that's followed by a red candle with a long upper wick, something changed. Buyers pushed up, but sellers stepped in. This might be the beginning of a reversal. Traders watch for these transitions because they often signal where the price is heading next.
Volume matters too, though you won't see it in the candlestick itself. A large body with huge volume means conviction. A large body on tiny volume? Suspicious. Maybe not many traders actually agree with the move. You'll want to check the volume bars below the chart to confirm what the candlesticks are telling you.
Educational Information
This article is for educational purposes only. Understanding candlestick charts and price action patterns is foundational knowledge, but it's not investment advice or trading guidance. Market prices move based on countless factors, and past patterns don't guarantee future results. Always do your own research, consider your risk tolerance, and consult with a qualified financial advisor before making any trading or investment decisions. Trading and investing carry real financial risk.
Start Your Journey
Candlestick charts aren't just pretty visuals — they're a language. Once you understand what you're looking at, you'll spot patterns, recognize shifts in momentum, and understand why the price moved the way it did. It takes practice to get comfortable reading them, but you're not learning something complicated. You're learning something straightforward that professionals use every single day.
Start by opening a chart of something you're interested in. Look at the bodies and wicks. Watch how they change over time. Notice when big moves happen and what the candles looked like before they occurred. This real-world practice beats any amount of theory. You'll develop an intuition for price action that'll stay with you.
Ready to explore more market concepts?
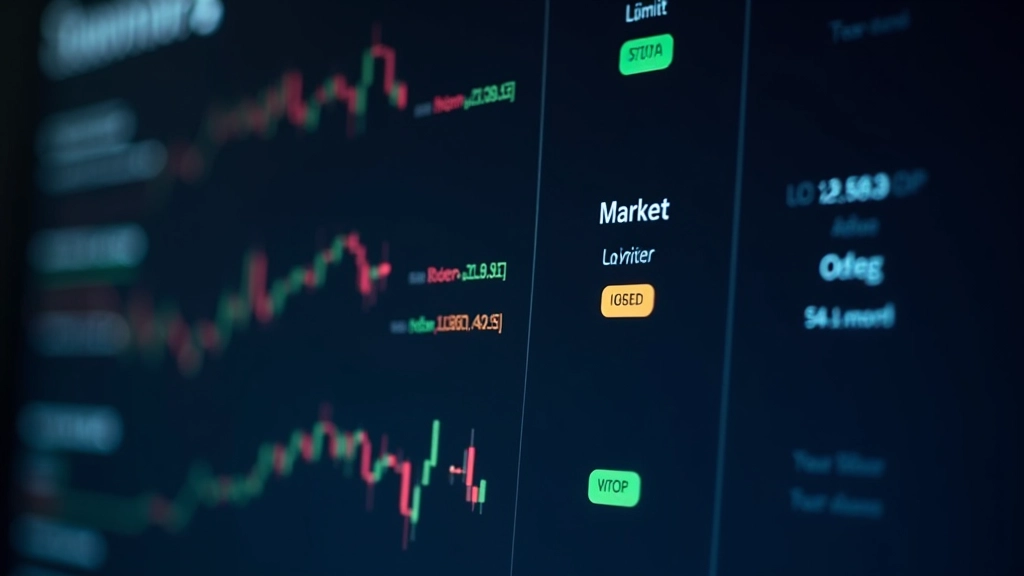
Learn About Order Types